
Recently, I became interested in Norges Bank Investment Management and started looking into cybersecurity roles there. While learning more about NBIM and how it operates, I kept asking myself one simple question:
What actually drives the growth of NBIM’s fund over time?
NBIM manages Norway’s oil and gas wealth through the Government Pension Fund Global, investing it globally on behalf of the Norwegian people. After oil was discovered in 1969, revenues were initially used directly to build the country, funding infrastructure, welfare, and public services. As income grew, Norway deliberately chose to save for the future. This led to the creation of the fund and, later, NBIM in 1998, turning finite oil wealth into long-term investments.
What stands out about NBIM is its unusually high level of transparency. The fund’s value, returns, and risk figures are publicly available and updated frequently. NBIM’s CEO, Nicolai Tangen, also shares insights through his In Good Company podcast and a TED talk, where he talks about long-term thinking, leadership, and separating signal from noise in complex systems. That perspective strongly influenced how I approached this small analysis.
Large financial systems are often analysed using complex models, forecasts, and assumptions. While those approaches have their place, they can also make it harder to see what is actually happening.
Instead, I chose a deliberately simple approach: work directly with public, cumulative historical data, and ask basic questions that can be answered with arithmetic rather than modelling. The goal was clarity, not prediction.
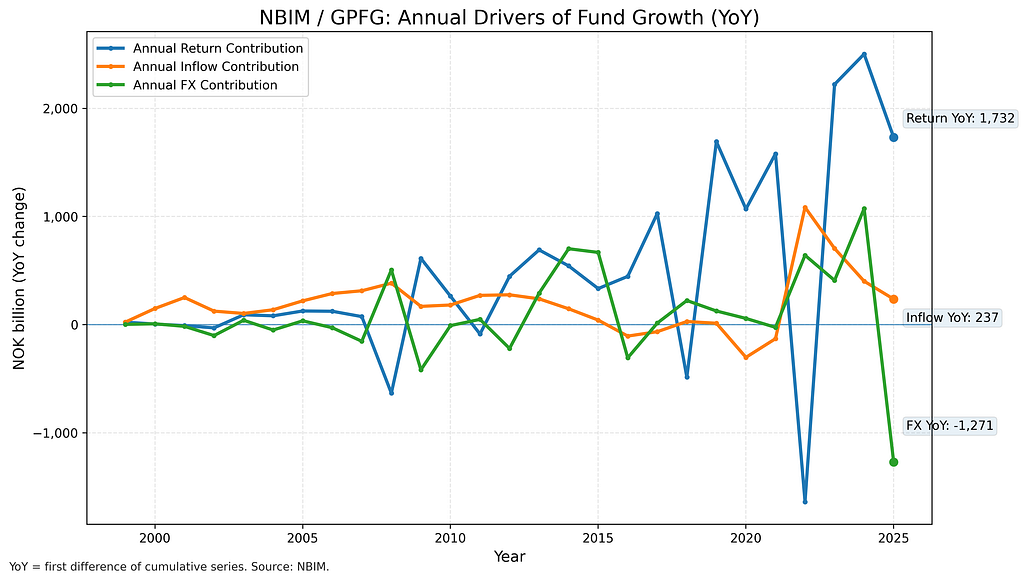
Using NBIM’s published data, I decomposed the fund’s total value into three intuitive components:
This approach avoids assumptions and focuses on what the data already tells us.
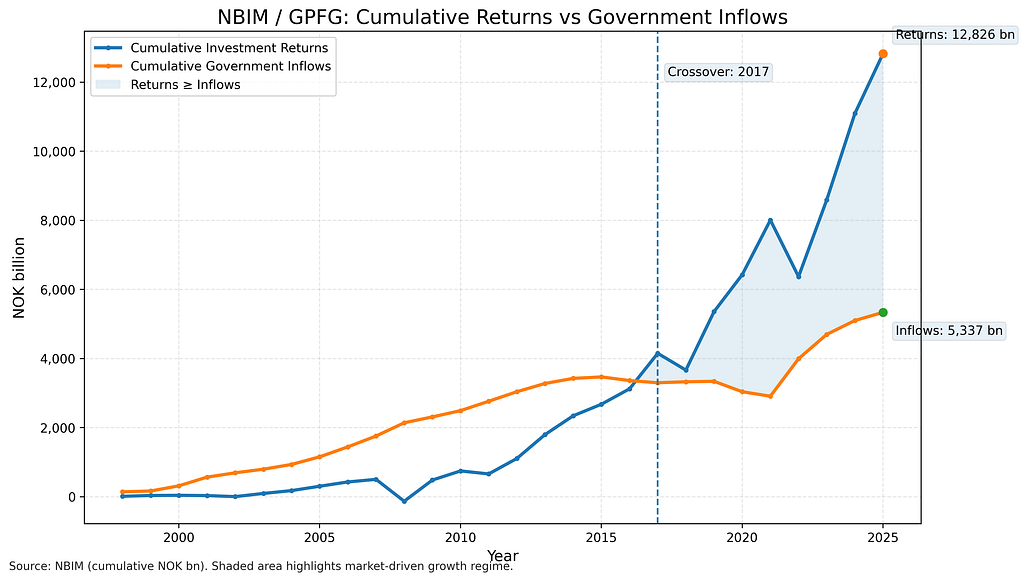
Looking at data from 1998 to 2025, a clear structural pattern emerges.
By the end of 2025:
Most notably, the data shows a crossover around 2017, when cumulative investment returns first exceeded cumulative inflows. From that point onward, the fund’s growth has been driven primarily by market performance rather than new oil revenues.
This isn’t a forecast or a model; it’s a direct comparison of cumulative values published by NBIM.
This simple decomposition highlights a fundamental transition in the fund’s nature.
The data show that NBIM is no longer growing, mainly because new capital is no longer flowing in. Instead, its growth increasingly depends on how well it manages investment performance, risk, and resilience across global markets.
That shift has important implications:
In other words, the fund has moved from being primarily oil-funded to being market-driven.
This analysis is intentionally narrow. It does not break down asset classes, evaluate benchmarks, or assess active management decisions. It does not predict future returns.
Its purpose is simpler: to show, using public data and basic arithmetic, what has driven the fund’s growth so far.
I built this small project out of curiosity, inspired by NBIM’s emphasis on transparency, long-term responsibility, and clarity over complexity. The analysis uses only publicly available data, focuses on separating signal from noise, and is shared openly.
You can find the full code and analysis on GitHub here.
If I’ve misunderstood any details or made mistakes, I welcome corrections. The intent is learning and discussion, not final answers.
<hr><p>What Actually Drives Norges Bank Investment Management’s Fund Growth? was originally published in DataDrivenInvestor on Medium, where people are continuing the conversation by highlighting and responding to this story.</p>